Ceph
PLEASE NOTE: This document applies to v1.4 version and not to the latest stable release v1.9
EdgeFS Monitoring
Each Rook EdgeFS cluster has some built in metrics collectors/exporters for monitoring with Prometheus.
If you do not have Prometheus running, follow the steps below to enable monitoring of Rook. If your cluster already
contains a Prometheus instance, it will automatically discover Rooks scrape endpoint using the standard
prometheus.io/scrape and prometheus.io/port annotations.
Prometheus Operator
First the Prometheus operator needs to be started in the cluster so it can watch for our requests to start monitoring Rook and respond by deploying the correct Prometheus pods and configuration. A full explanation can be found in the Prometheus operator repository on GitHub, but the quick instructions can be found here:
kubectl apply -f https://raw.githubusercontent.com/coreos/prometheus-operator/v0.27.0/bundle.yaml
This will start the Prometheus operator, but before moving on, wait until the operator is in the Running state:
kubectl get pod
Once the Prometheus operator is in the Running state, proceed to the next section.
Prometheus Instances
With the Prometheus operator running, we can create a service monitor that will watch the Rook cluster and collect metrics regularly. From the root of your locally cloned Rook repo, go the monitoring directory:
git clone --single-branch --branch v1.4.9 https://github.com/rook/rook.git
cd rook/cluster/examples/kubernetes/edgefs/monitoring
Create the service monitor as well as the Prometheus server pod and service:
kubectl create -f service-monitor.yaml
kubectl create -f prometheus.yaml
kubectl create -f prometheus-service.yaml
Ensure that the Prometheus server pod gets created and advances to the Running state before moving on:
kubectl -n rook-edgefs get pod prometheus-rook-prometheus-0
Prometheus Web Console
Once the Prometheus server is running, you can open a web browser and go to the URL that is output from this command:
echo "http://$(kubectl -n rook-edgefs -o jsonpath={.status.hostIP} get pod prometheus-rook-prometheus-0):30900"
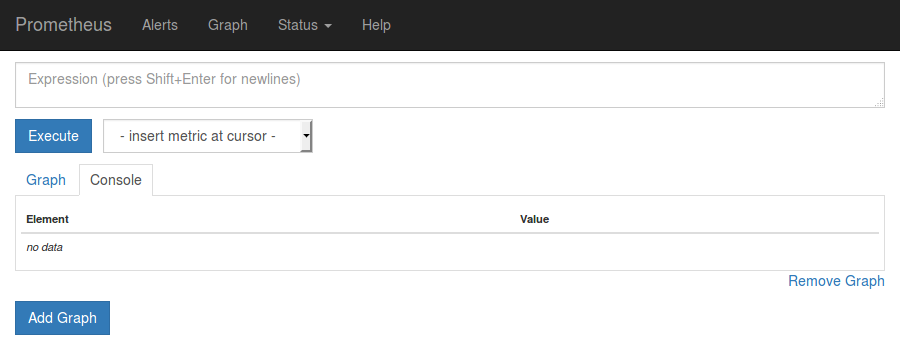
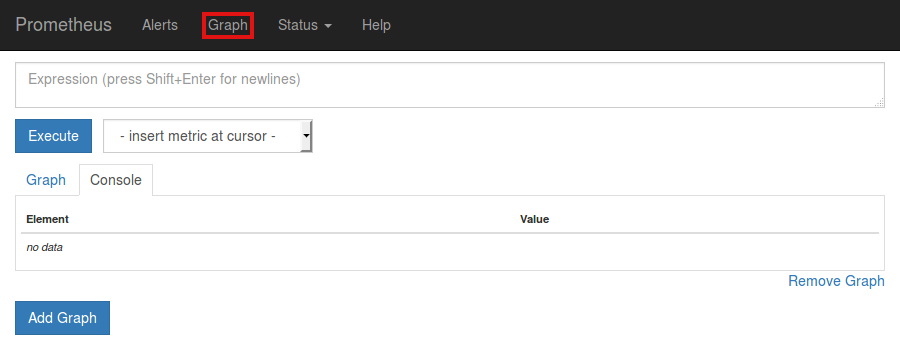
You should now see the Prometheus monitoring website.

Click on Graph in the top navigation bar.

In the dropdown that says insert metric at cursor, select any metric you would like to see, for example nedge_cluster_objects.
Below the Execute button, ensure the Graph tab is selected and you should now see a graph of your chosen metric over time.
Prometheus Consoles
A guide to how you can write your own Prometheus consoles can be found on the official Prometheus site here: Prometheus.io Documentation - Console Templates.
Grafana Dashboards
For feedback on the dashboards please reach out to him on the Rook.io Slack.
NOTE: The dashboard only compatible with Grafana 5.0.3 or higher.
The following Grafana dashboard is available:
Teardown
To clean up all the artifacts created by the monitoring walkthrough, copy/paste the entire block below (note that errors about resources “not found” can be ignored):
kubectl delete -f service-monitor.yaml
kubectl delete -f prometheus.yaml
kubectl delete -f prometheus-service.yaml
kubectl delete -f https://raw.githubusercontent.com/coreos/prometheus-operator/v0.27.0/bundle.yaml
Then the rest of the instructions in the Prometheus Operator docs can be followed to finish cleaning up.
