Ceph
PLEASE NOTE: This document applies to v1.7 version and not to the latest stable release v1.9
Prometheus Monitoring
Each Rook Ceph cluster has some built in metrics collectors/exporters for monitoring with Prometheus.
If you do not have Prometheus running, follow the steps below to enable monitoring of Rook. If your cluster already
contains a Prometheus instance, it will automatically discover Rooks scrape endpoint using the standard
prometheus.io/scrape and prometheus.io/port annotations.
NOTE: This assumes that the Prometheus instances is searching all your Kubernetes namespaces for Pods with these annotations.
Prometheus Operator
First the Prometheus operator needs to be started in the cluster so it can watch for our requests to start monitoring Rook and respond by deploying the correct Prometheus pods and configuration. A full explanation can be found in the Prometheus operator repository on GitHub, but the quick instructions can be found here:
kubectl apply -f https://raw.githubusercontent.com/coreos/prometheus-operator/v0.40.0/bundle.yaml
This will start the Prometheus operator, but before moving on, wait until the operator is in the Running state:
kubectl get pod
Once the Prometheus operator is in the Running state, proceed to the next section to create a Prometheus instance.
Prometheus Instances
With the Prometheus operator running, we can create a service monitor that will watch the Rook cluster and collect metrics regularly. From the root of your locally cloned Rook repo, go the monitoring directory:
$ git clone --single-branch --branch v1.7.11  https://github.com/rook/rook.git
cd rook/cluster/examples/kubernetes/ceph/monitoring
Create the service monitor as well as the Prometheus server pod and service:
kubectl create -f service-monitor.yaml
kubectl create -f prometheus.yaml
kubectl create -f prometheus-service.yaml
Ensure that the Prometheus server pod gets created and advances to the Running state before moving on:
kubectl -n rook-ceph get pod prometheus-rook-prometheus-0
NOTE: It is not recommended to consume storage from the Ceph cluster for Prometheus. If the Ceph cluster fails, Prometheus would become unresponsive and thus not alert you of the failure.
Prometheus Web Console
Once the Prometheus server is running, you can open a web browser and go to the URL that is output from this command:
echo "http://$(kubectl -n rook-ceph -o jsonpath={.status.hostIP} get pod prometheus-rook-prometheus-0):30900"
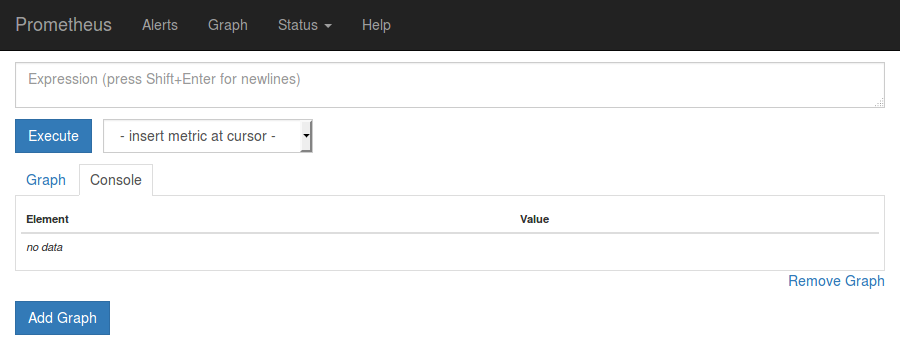
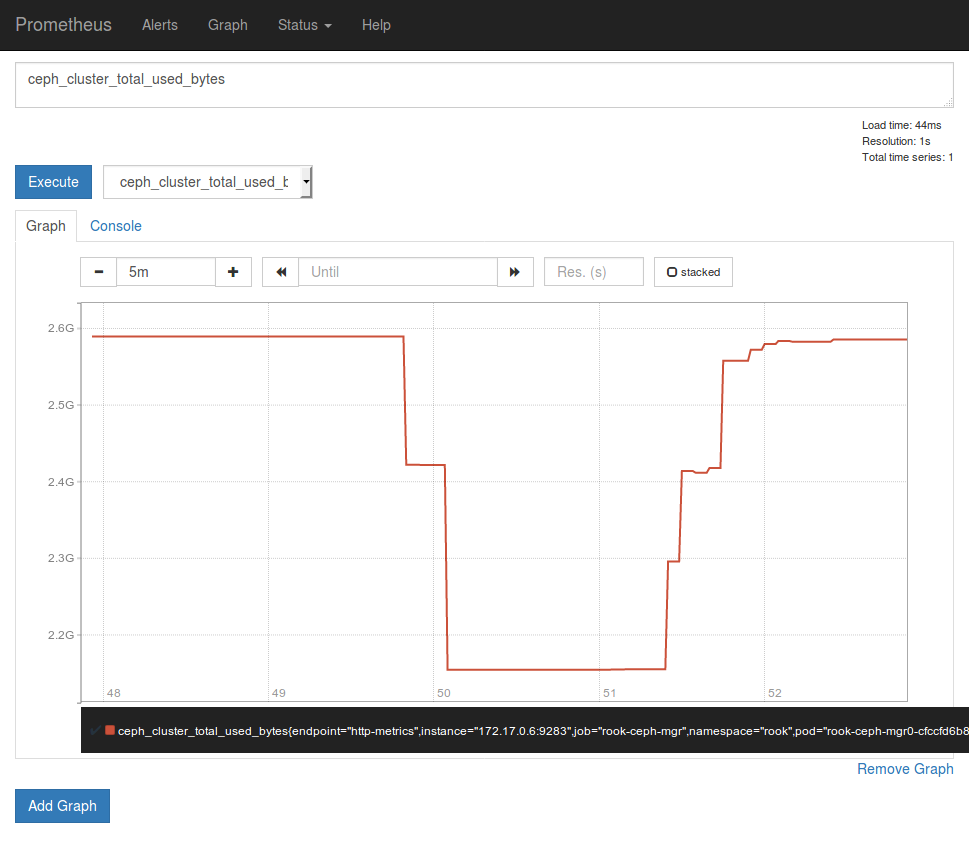
You should now see the Prometheus monitoring website.
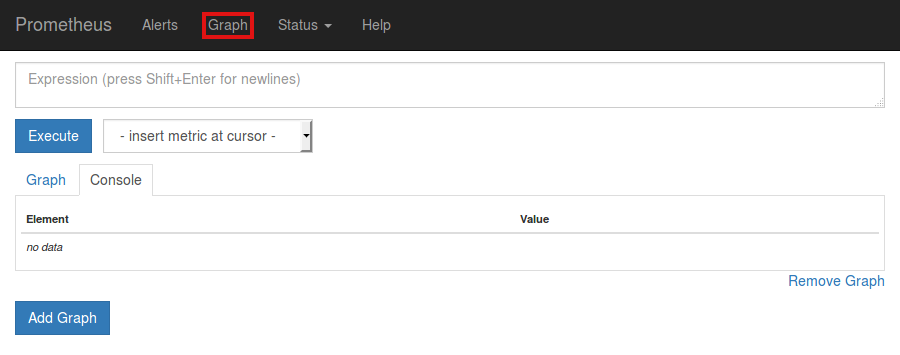
Click on Graph in the top navigation bar.
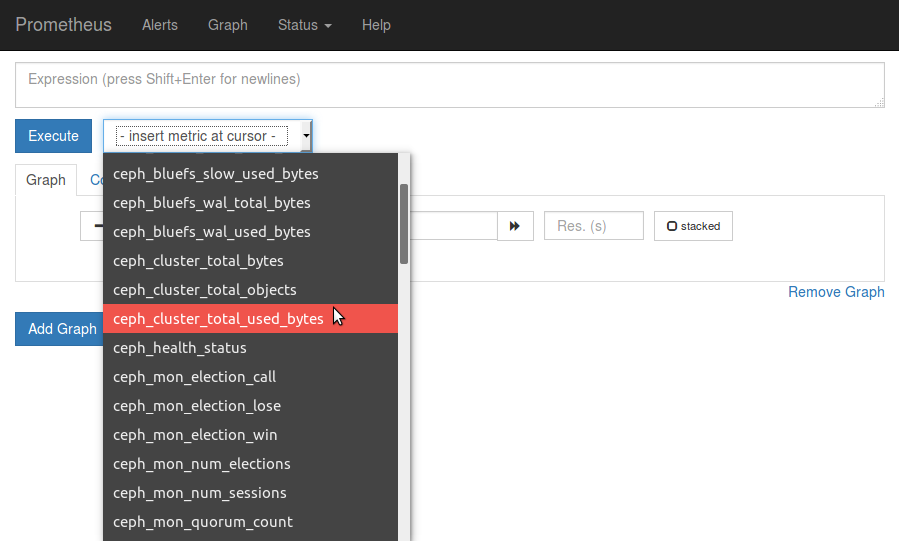
In the dropdown that says insert metric at cursor, select any metric you would like to see, for example ceph_cluster_total_used_bytes
Click on the Execute button.
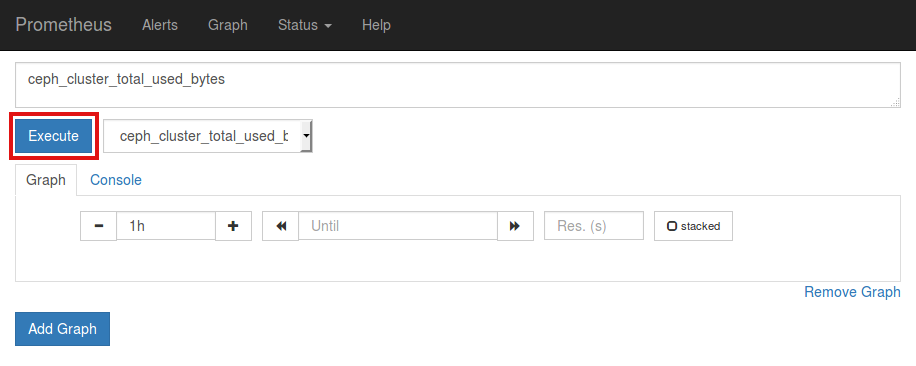
Below the Execute button, ensure the Graph tab is selected and you should now see a graph of your chosen metric over time.
Prometheus Consoles
You can find Prometheus Consoles for and from Ceph here: GitHub ceph/cephmetrics - dashboards/current directory.
A guide to how you can write your own Prometheus consoles can be found on the official Prometheus site here: Prometheus.io Documentation - Console Templates.
Prometheus Alerts
To enable the Ceph Prometheus alerts follow these steps:
- Create the RBAC rules to enable monitoring.
kubectl create -f cluster/examples/kubernetes/ceph/monitoring/rbac.yaml
- Make following changes to your CephCluster object (e.g.,
cluster.yaml).
apiVersion: ceph.rook.io/v1
kind: CephCluster
metadata:
  name: rook-ceph
  namespace: rook-ceph
[...]
spec:
[...]
  monitoring:
    enabled: true
    rulesNamespace: "rook-ceph"
[...]
(Where rook-ceph is the CephCluster name / namespace)
- Deploy or update the CephCluster object.
kubectl apply -f cluster.yaml
NOTE: This expects the Prometheus Operator and a Prometheus instance to be pre-installed by the admin.
Grafana Dashboards
The dashboards have been created by @galexrt. For feedback on the dashboards please reach out to him on the Rook.io Slack.
NOTE: The dashboards are only compatible with Grafana 7.2.0 or higher.
Also note that the dashboards are updated from time to time, to fix issues and improve them.
The following Grafana dashboards are available:
Updates and Upgrades
When updating Rook, there may be updates to RBAC for monitoring. It is easy to apply the changes
with each update or upgrade. This should be done at the same time you update Rook common resources
like common.yaml.
kubectl apply -f cluster/examples/kubernetes/ceph/monitoring/rbac.yaml
This is updated automatically if you are upgrading via the helm chart
Teardown
To clean up all the artifacts created by the monitoring walk-through, copy/paste the entire block below (note that errors about resources “not found” can be ignored):
kubectl delete -f service-monitor.yaml
kubectl delete -f prometheus.yaml
kubectl delete -f prometheus-service.yaml
kubectl delete -f https://raw.githubusercontent.com/coreos/prometheus-operator/v0.40.0/bundle.yaml
Then the rest of the instructions in the Prometheus Operator docs can be followed to finish cleaning up.
Special Cases
Tectonic Bare Metal
Tectonic strongly discourages the tectonic-system Prometheus instance to be used outside their intentions, so you need to create a new Prometheus Operator yourself.
After this you only need to create the service monitor as stated above.
CSI Liveness
To integrate CSI liveness and grpc into ceph monitoring we will need to deploy a service and service monitor.
kubectl create -f csi-metrics-service-monitor.yaml
This will create the service monitor to have promethues monitor CSI
Collecting RBD per-image IO statistics
RBD per-image IO statistics collection is disabled by default. This can be enabled by setting enableRBDStats: true in the CephBlockPool spec.
Prometheus does not need to be restarted after enabling it.
Using custom label selectors in Prometheus
If Prometheus needs to select specific resources, we can do so by injecting labels into these objects and using it as label selector.
apiVersion: ceph.rook.io/v1
kind: CephCluster
metadata:
  name: rook-ceph
  namespace: rook-ceph
[...]
spec:
[...]
labels:
  monitoring:
    prometheus: k8s
[...]
Horizontal Pod Scaling using Kubernetes Event-driven Autoscaling (KEDA)
Using metrics exported from the Prometheus service, the horizontal pod scaling can use the custom metrics other than CPU and memory consumption. It can be done with help of Prometheus Scaler provided by the KEDA. See the KEDA deployment guide for details.
Following is an example to autoscale RGW:
apiVersion: keda.k8s.io/v1alpha1
kind: ScaledObject
metadata:
 name: rgw-scale
 namespace: rook-ceph
spec:
 scaleTargetRef:
   kind: Deployment
   deploymentName: rook-ceph-rgw-my-store-a # deployment for the autoscaling
 minReplicaCount: 1
 maxReplicaCount: 5
 triggers:
 - type: prometheus
   metadata:
     serverAddress: http://rook-prometheus.rook-ceph.svc:9090
     metricName: collecting_ceph_rgw_put
     query: |
       sum(rate(ceph_rgw_put[2m])) # promethues query used for autoscaling
     threshold: "90"